We have just witnessed a powerful rally off of the mid-June lows (IV. on the chart). It doesn’t happen very often for an index to rise 19% within two months. Whether it’s a rally within a Bear Market or the beginning of a new Bull Market is yet to be seen, but the geopolitical circumstances: energy crisis and surging inflation, support the assumption that the Bear isn’t done yet.
The analysis will be based mostly on simple technical analysis (trend lines, volume), macro factors and (foremost) on my feelings and observations while trading the Rally intensively. There will be quite a few references in the text to the letters and numbers marked on the chart below.
2022 Bear Market – overview
The Bear Market of 2022 began on January 5 and within half a year took 25% off of the S&P500. There were three short lived, although strong rallies (I. – 8.75%, II. – 12.61%, III. – 9.58%) which emerged from bottoming consolidation and finished with 1-2 weeks of distribution. These distributions felt like consolidations before a further move up, because the indices hadn’t really corrected in their initial move of each rally.
The third rally (III.) finished with an abrupt free fall of the indices. 3 consecutive sessions with 3-4% drawdowns. It was a cathartic experience. Fintwit was split between those arguing this was the inevitable final flush before the bottoming of the indices. Others disagreed pointing at VIX (the volatility index) which did not spike enough to prove the bottom was struck.
On a personal note: I managed to make use of the first two rallies (I. and II.) to make back what I lost in the corrections in November and December 2021. I positioned myself extremely aggressively before the second rally, but sold out way before its apex missing another 20% of the move. All what I’ve earned I gave back on the way down from rally II. because I kept “buying a dip”. I had another great shot on rally III. and made back all what I lost and some. I thought the top of the rally III. was just a consolidation before further advance and I haven’t sold anything. Even worse – each day of a slump I was leveraging up thinking the Market would turn back up the next day. I was biased because of an analyst who kept preaching an imminent recovery of the Market. I cannot blame it on him though. After such quick recoveries from drawdowns I started feeling complacent – and the Market showed me what she does with such.
The destructive free fall after rally III. took away 25% of my portfolio (including the gains – so down 7% from initial level). This was the culmination of the first year of my active trading.
The Rally
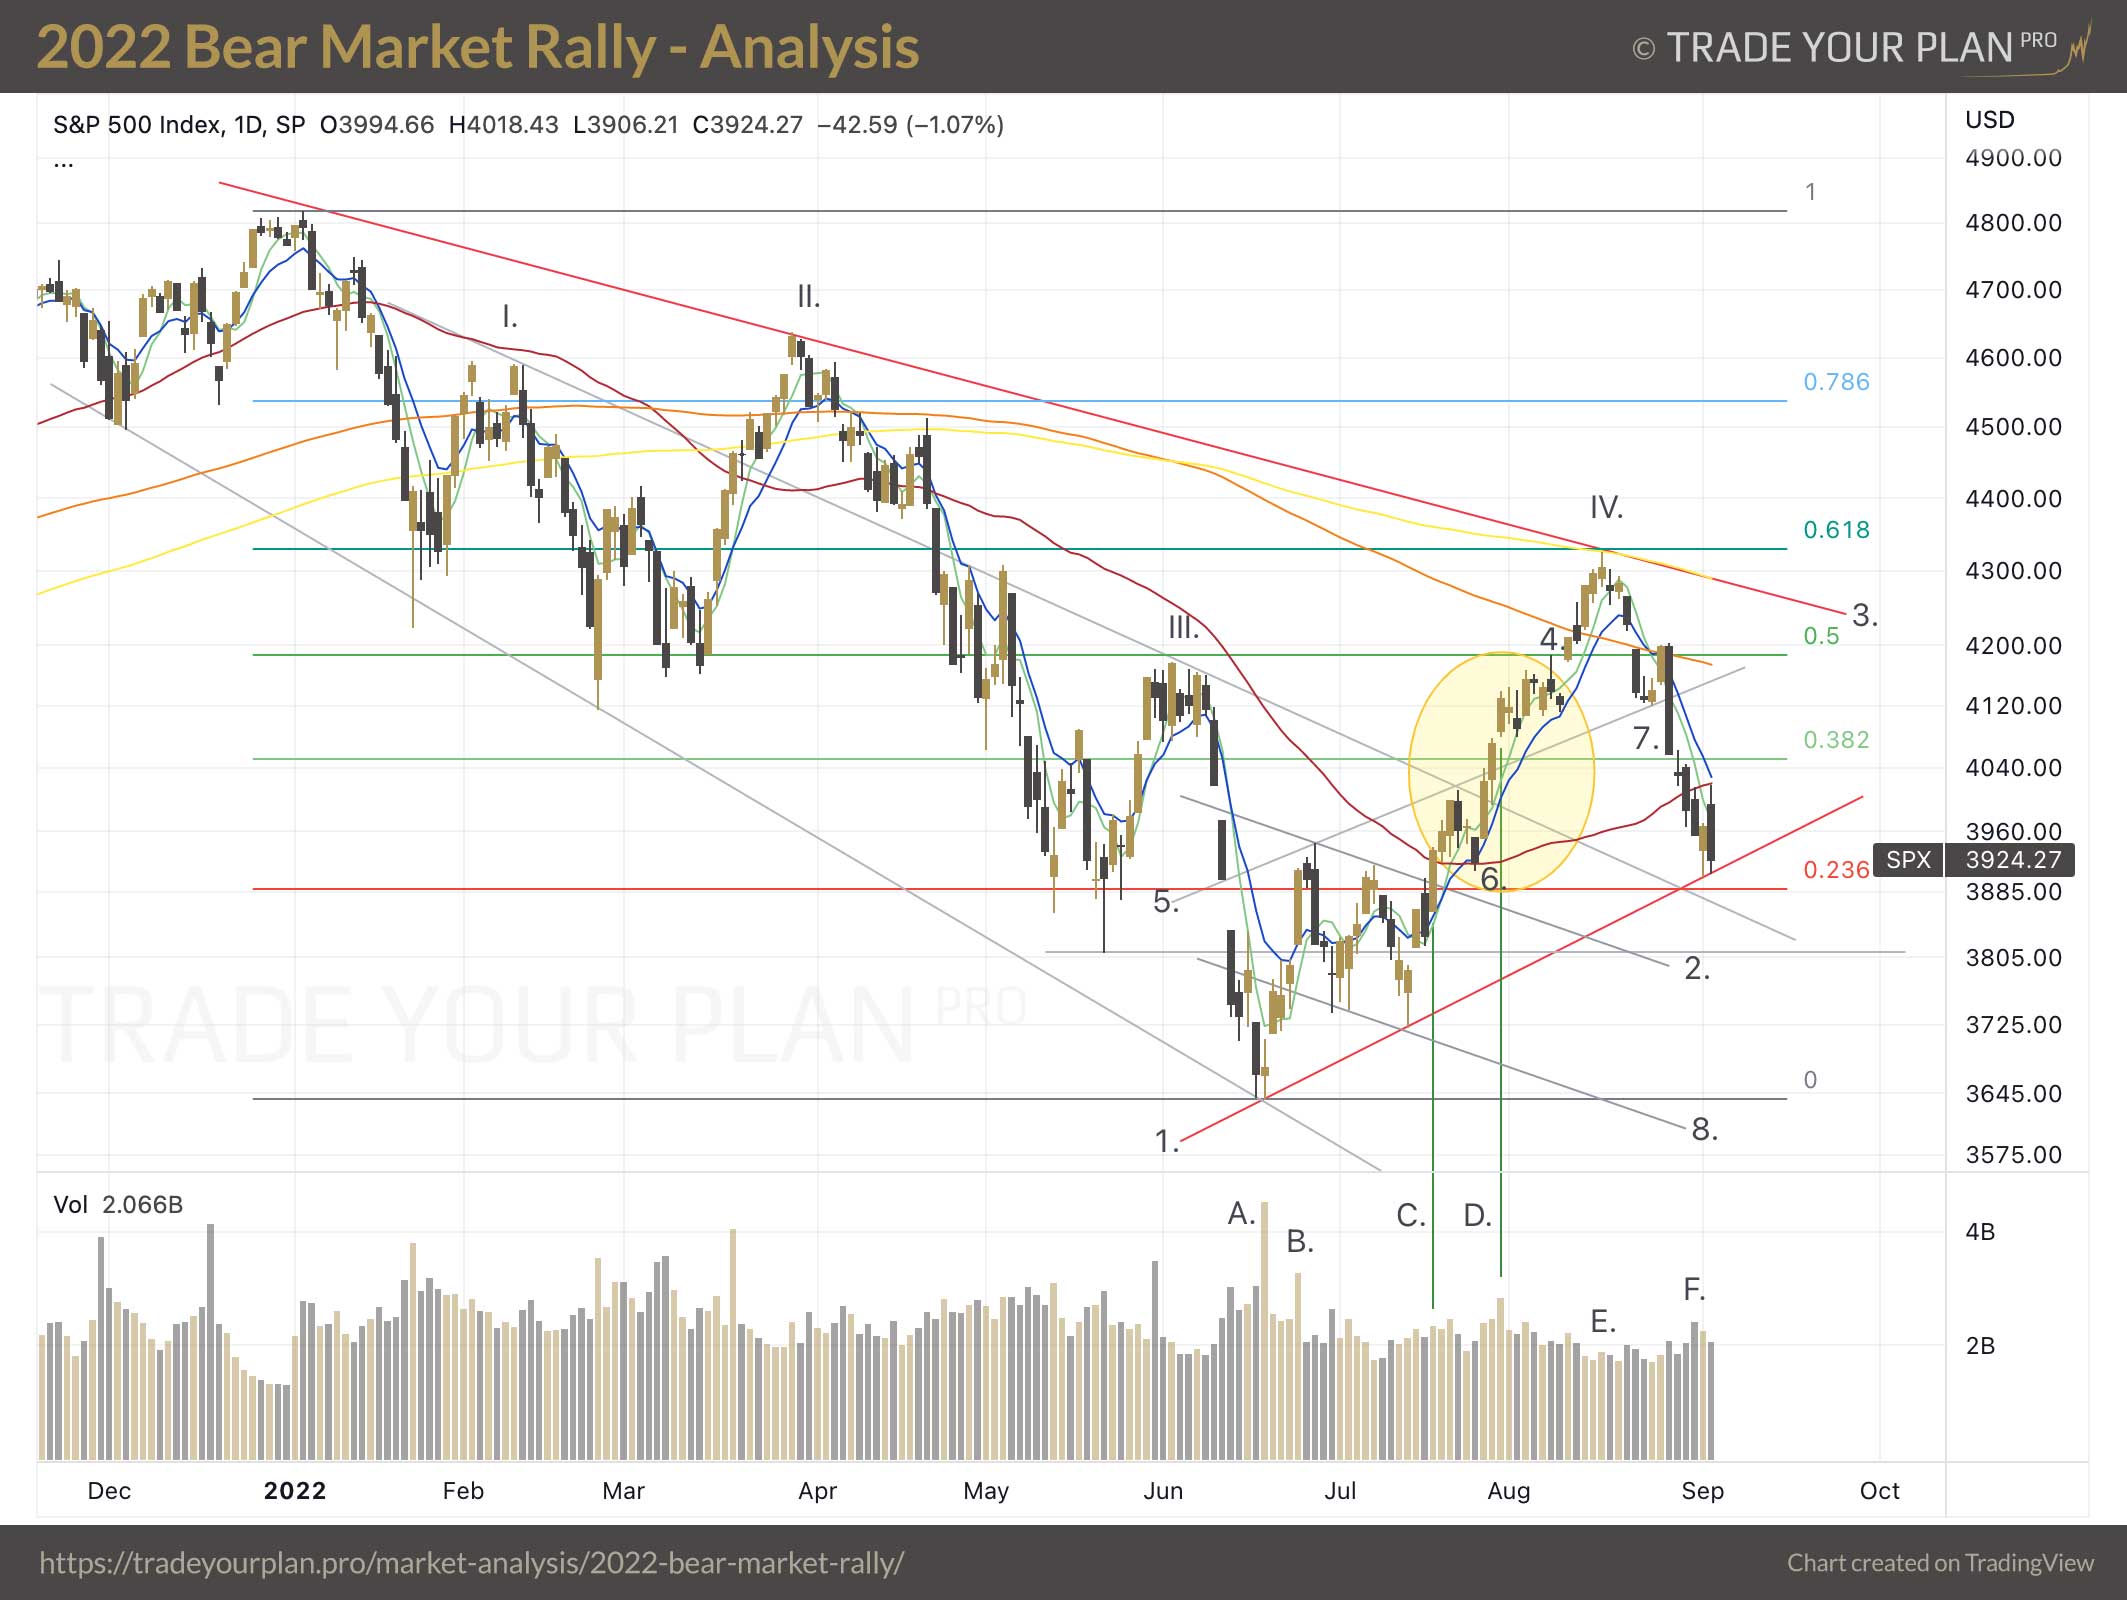
The Market bottomed on June 16-17. The preceding fall sent the indices into such oversold territories that many traders were anticipating a flip much sooner. On June 17 the Volume spiked to extremely high levels (A.), the index gained only 0.22%, but the intraday move was more than 2%. The big money collected all the supply thrown at the Market by desperate investors.
The first sectors to emerge from the abyss were Biotechnology and Solar. In fact, few weeks before the bottom the volume in XBI and TAN (the Biotechnology and Solar ETFs) significantly increased.
The S&P shot up to gain 8% within 5 sessions. It then corrected, but didn’t strike a lower low and switched to climb almost 5%. It didn’t reach the previous high though. It corrected again making a dip just below the previous low, but above the bottom from June 17. In two weeks the index drew a nice descending flag (trend line 2. and 8.). As it turned up again it shot through the descending flag’s upper line in volume (point C.). Usually after breaking a resistance the price retests it after few days from the other side – meaning the resistance becomes support. The index was so strong though that it didn’t make it all the way back to the line. It corrected a bit, but shot right up the next day (point 6.).
It was on July 26 when the Fed raised the interest rates by .75, which was what they planned to do, but the whole world considered it as a dovish pivot. If you look at the chart – the index took off bouncing up from the 50DMA.
The rally that followed took the S&P to 4100-4200. It was the level, where the Market consolidated and eventually broke down on rally III. In addition the volume was so large, when approaching these levels, that it felt like distribution (point D.). After a week of consolidation the CPI data dropped in on August 9 – obviously due to lower gasoline prices in the last few months it was easy to assume that the inflation reading would be better than anticipated. This gave the investors another reason to rally. Until S&P hit the ceiling.
The Ceiling
The top of this astonishing rally – 19% in two months – was struck in a magic turn point, where three strong resisting factors lined up:
- the 200DMA
- .618 Fibonacci retracement of the entire Bear drop
- major resistance line connecting two previous tops (red line 3.).
It was quite an incredible sight. The moment S&P touched the point, it rolled over. And the whole Market followed. No distribution whatsoever. No time spent on the summit to relax, look around, enjoy the view. Just immediate descend. It halted briefly on the trend line 5. which connected the tops of the initial move of the rally. But on August 26 the whole Market tumbled almost 4% after Jerome Powell’s speech in Jackson Hole, where he said nothing new. This time though he used more direct wording – probably as a reaction to the extravagant rally that preceded the event.
Since then the Market was in a free fall. It bounced for a day on the support line 1. which could be expected after such a strong fall. But it tumbled 100 points down right next day after hitting the 50DMA. Many bulls must have gotten trapped by this swift reversal.
Getting whipsawed
As always – in hindsight everything looks easy. There is a sound explanation for each move of that rally.
In reality – I completely misread the whole move. My first mistake was to draw the resistance line 5. as a parallel line to line 1. I got biased in thinking the index was creating a bear flag (lines 2. and 8.) before it confirmed to do so. When the S&P hit the line 5. for the second time, I got out of all my longs. I was also leaving for vacation so I did not want to risk it.
After I got out, the Market dropped to point 6. and rested on the 50DMA. This reassured me I did the right thing. The strong move up on the day of the Fed on July 26 fooled me as well. The whole last year the Market had reversed on the next day after the Fed meetings (it would always shoot up on the day of the Fed, but tumble on the next). I was sure it would tumble on July 27 after the initial move up. Additionally the index stopped that day exactly on my line 5. I was 100% sure it would go down the next day. But it moved up on huge volume (D.) which made me think it was a final distribution. It then consolidated in the zone, where it faltered on the previous rally. There was a surge of bad news from around the World about the energy crisis. It felt like the Market was ready to collapse again. I was on vacation but FOMO kicked in. I started shorting the Market. Too aggressively. The CPI came in as expected, the reaction of the Market was as one could expect, but I was on the wrong side of the Market. By the time the S&P hit the magic turn point I was exhausted and got out of all my shorts.
What’s worse – I initiated some long positions – my mind was sabotaged.
I had to step away for a few days. That Rally taught me quite a lot of things.
What’s next?
A popular quote among traders (attributed, although doubtfully, to Mark Twain) says:
History never repeats itself but it rhymes.
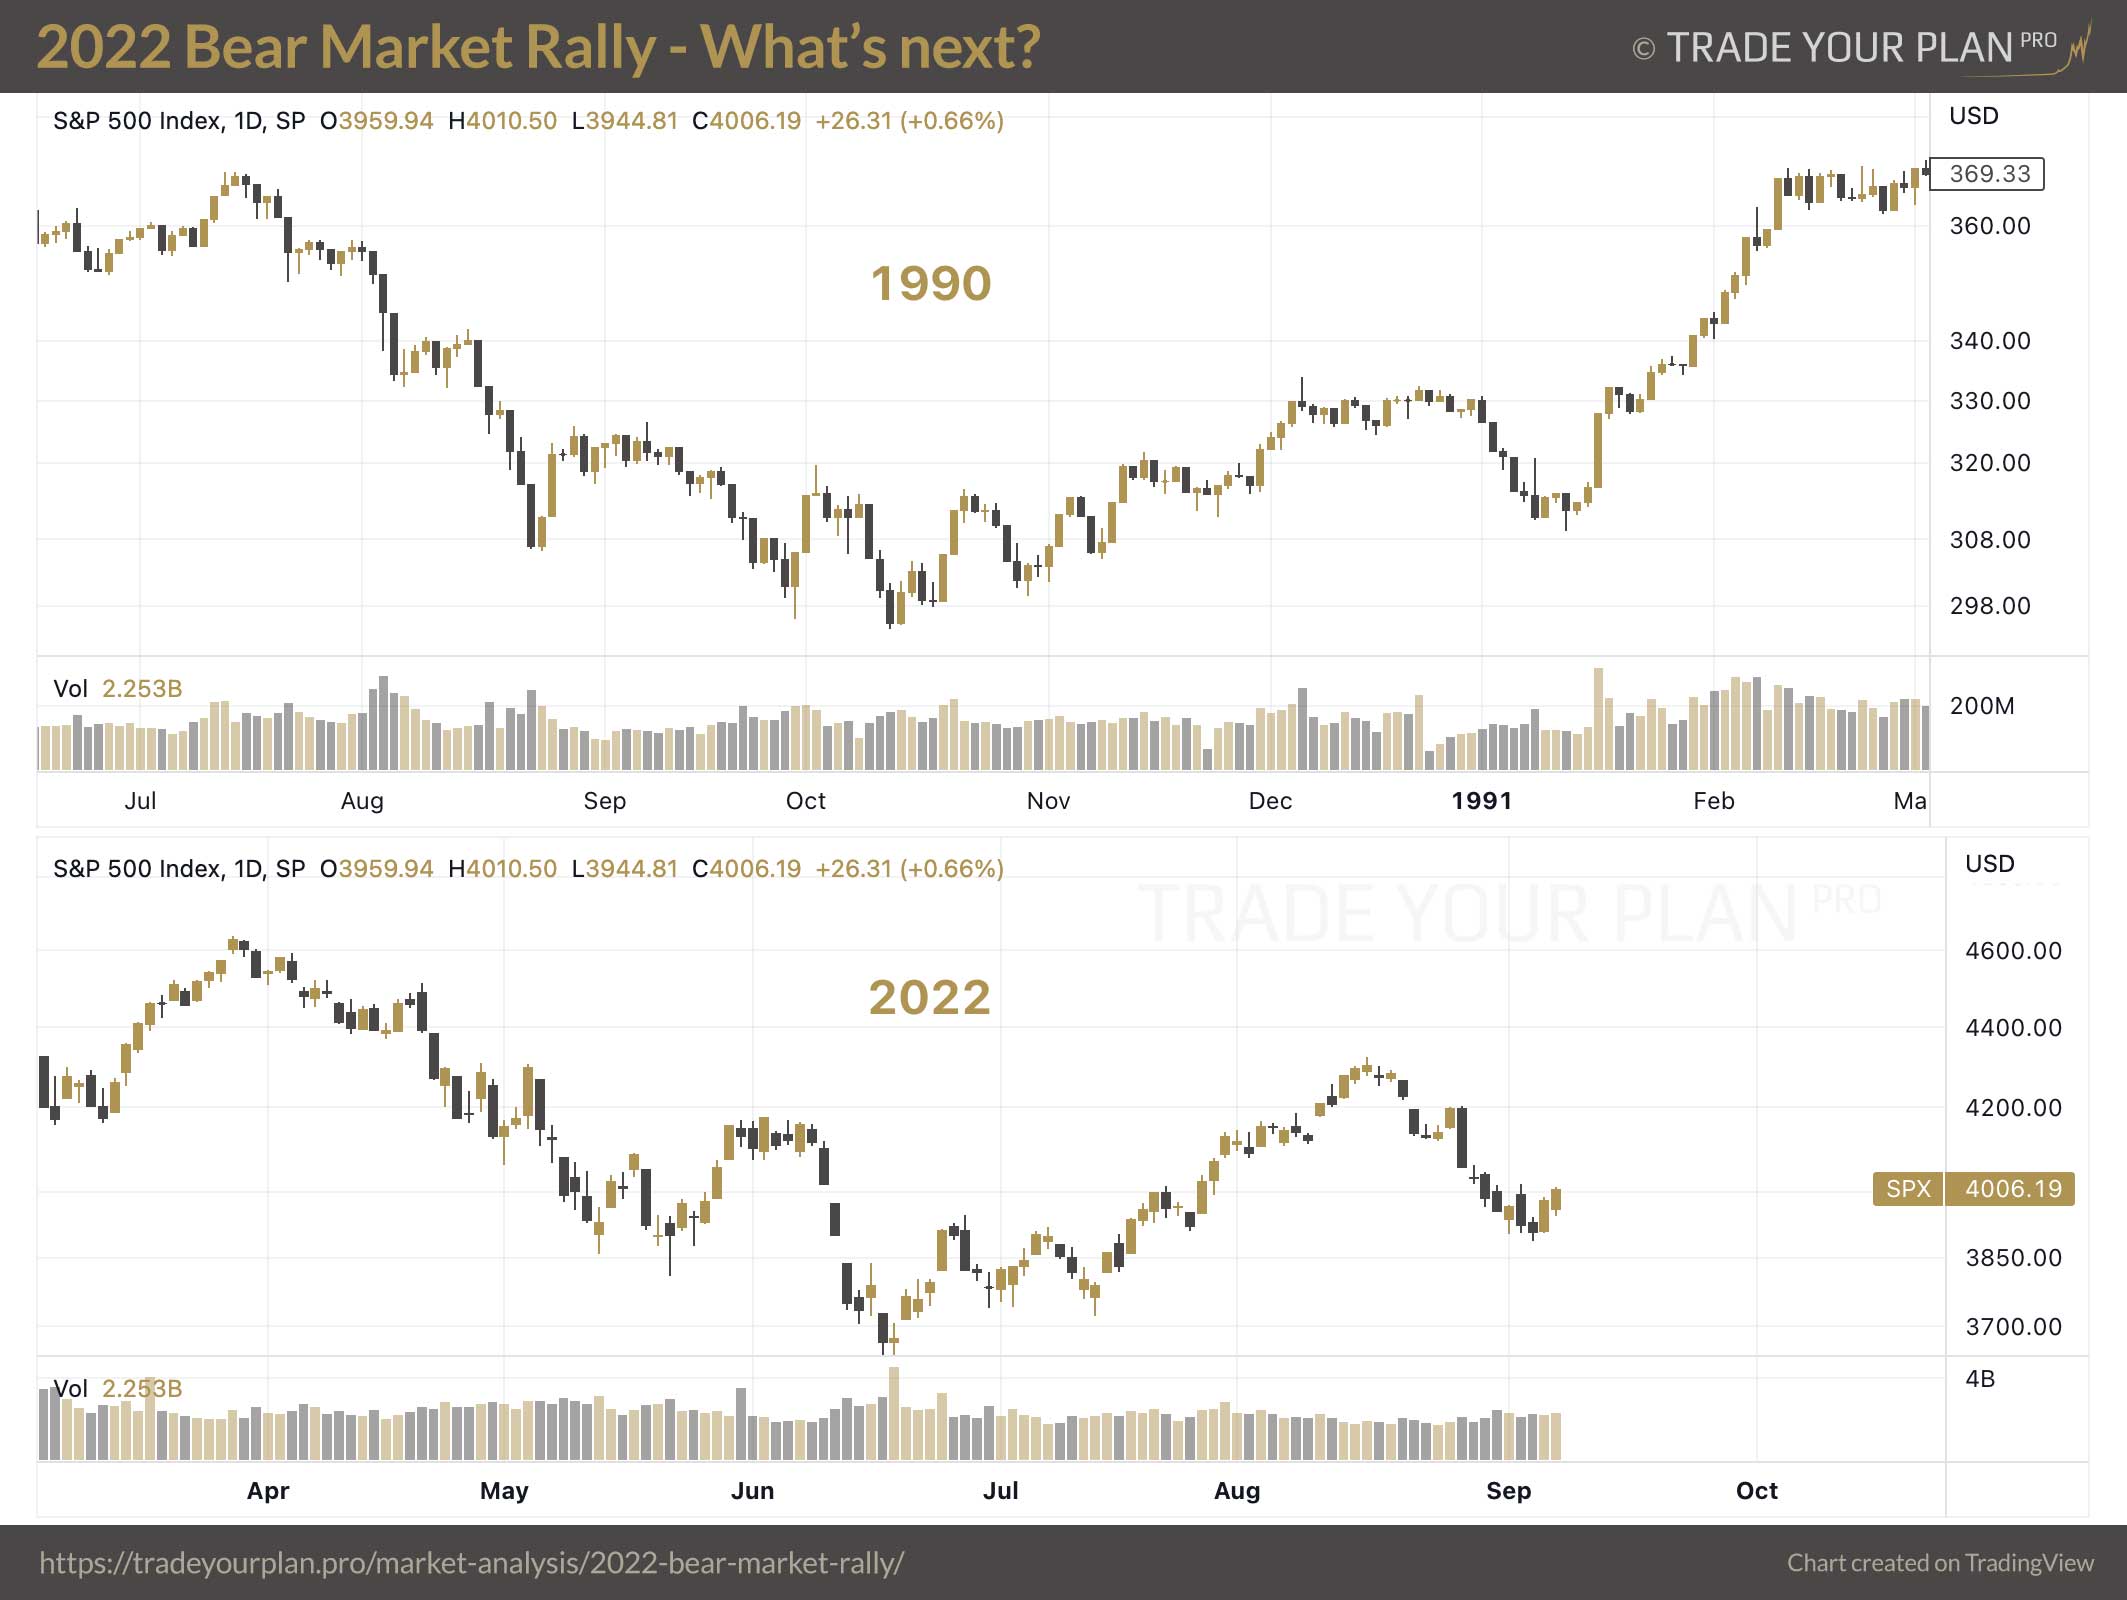
Well, this chart below compares the Bear Market of 1990 with the one we are just experiencing. The similarity up to this moment is quite stunning.
Avi Gilburt – the best Elliot Wave Analyst I know – just posted today:
This market is now presenting us with one of the most uncertain times I have dealt with during the 11 years that we have been open at ElliottWaveTrader. And, the month of September will likely be key to a resolution of the uncertainty.
At the end of the day – the Market will do what you want, but not when you expect it to. Stay alert and manage risk!
September 3, 2022.