One glance is worth a thousand Earnings Forecasts. 1
Stan Weinstein
The above quote is the chapter title of Stan Weinstein‘s book: Secrets for Profiting in Bull and Bear Markets, where he describes the principles of his famous Stage Analysis strategy.
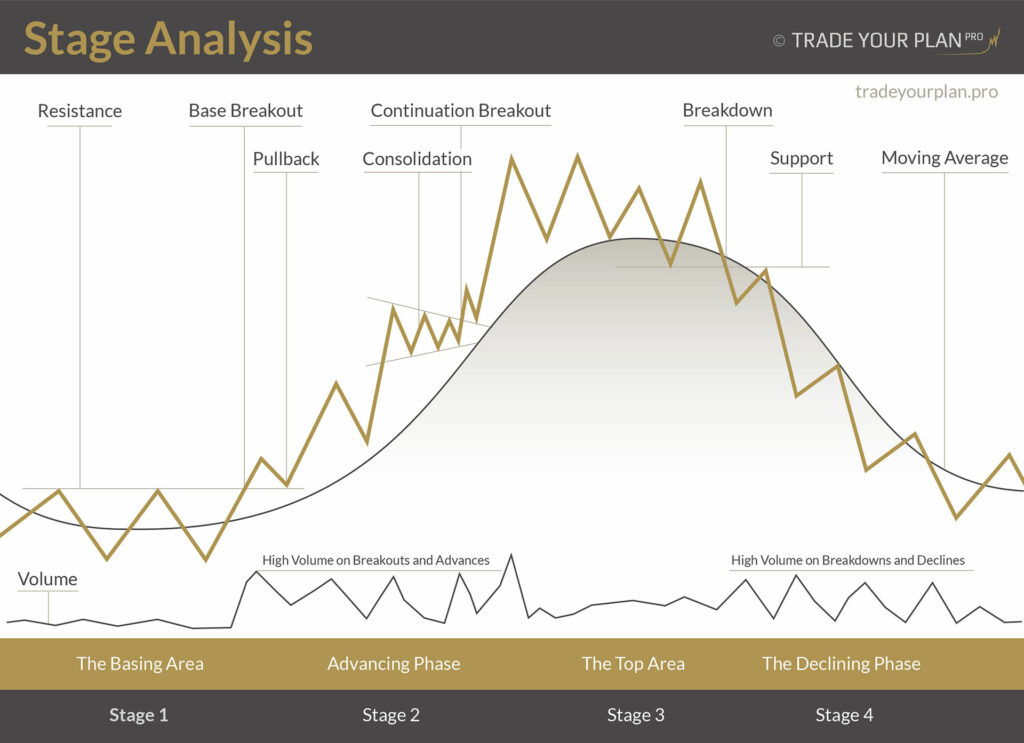
The strategy organises stock’s price action into four stages within a continuous cycle:
- The Basing Area
- The Advancing Stage
- The Top Area
- The Declining Stage.
The infographic below illustrates this cycle.

Stage Analysis – Key Components
Before describing each stage in detail, let’s examine the key components of Weinstein’s strategy:
Weekly Chart
Charts are fundamental to Weinstein’s strategy. He encourages using longer time-frame charts in order to see the overall progress of the stock’s price action. It helps to recognise the stage in which the stock is at the moment. In his own words:
If ever the cliché that a picture is worth a thousand words was true, this is a perfect example of it – in living color! 2
10- or 30-Week Moving Average
Moving Averages (MA) help to identify the trend of the stock. Weinstein uses mainly 30-Week Moving Average in his analysis. He admits though that the 10-Week Moving Average might be more suitable for short-term traders.
One of Weinstein’s principal trading rules is based on the Moving Average:
Stocks trading beneath their 30-week MA’s should never be considered for purchase, especially if the MA is declining. 3
Volume
Last but not least – each transition between stages – especially from 1 to 2 – should be confirmed by a significant increase in volume. Large volume is the evidence that the stock attracts attention and is ready for a big move.
The behaviour of volume is also a strong confirmation of stock’s trend:
- in an uptrend the volume is higher when the price increases and lower when the price decreases (Stage 2),
- in downtrend – the volume picks up while the stock is falling and weakens, when the price goes up (Stage 4).
Stages of the Stock
With the above in mind, let’s examine the characteristics of each stage:
Stage 1. The Basing Area
In the Basing Area the stock moves mostly sideways fluctuating above and below the flat 30-week moving average while forming the horizontal base.
The longer the base the better. A long base will establish a significant support level. During that time the stock will transfer from weak (uninformed) hands to strong (informed) hands.
Volume drops significantly as a base forms. It starts to pick up late in Stage 1 even though prices remain little changed.
This is the point where many market players get itchy to move in and catch the bottom price. But it doesn’t do much good to buy yet. Even if you catch the exact low, your money could be tied up for a long time with little movement, and time is money. 4
Stage 2. Advancing Phase
Base Brakeout
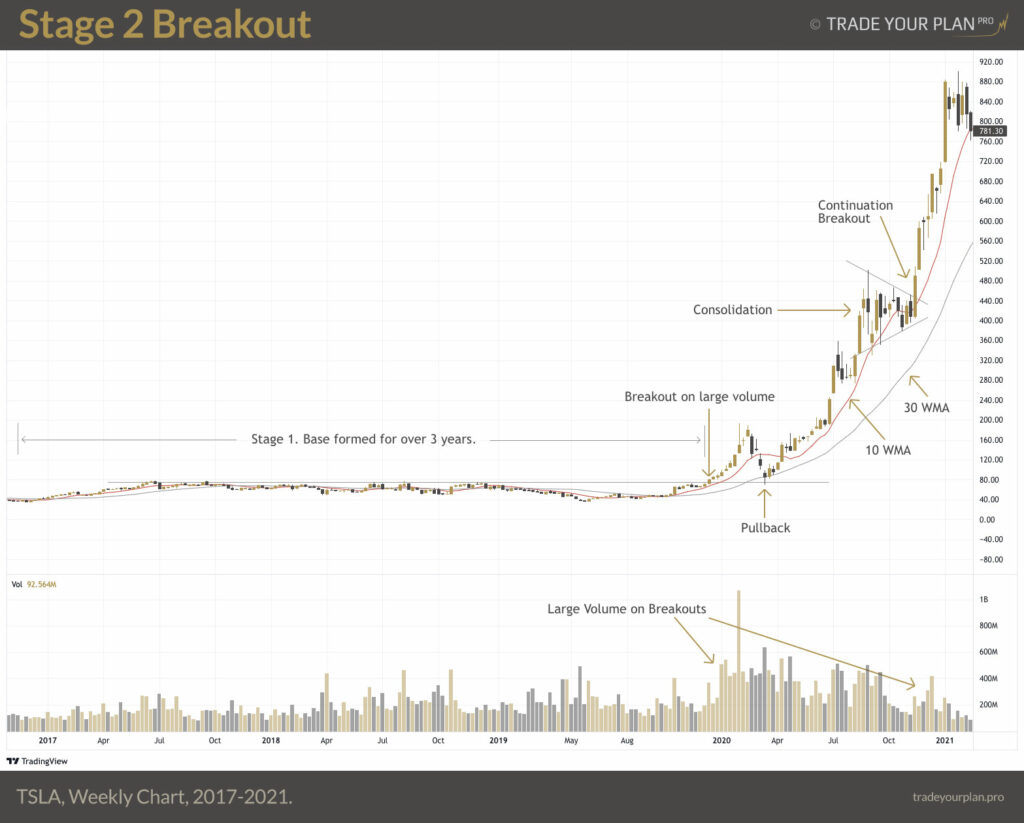
The ideal time to buy is when a stock is finally swinging out of its base into this more dynamic stage. Such a breakout above the top of the resistance zone and the 30-week MA should occur on impressive volume. 5
After the breakout from the base the stock usually pulls back to the former resistance line, which now becomes the support (view the infographic). This is the second chance to do low-risk buying. The pullback should occur on lighter volume.
The important feature of Stage 2 is that the stock makes higher-highs and higher lows pulling the Moving Average in the same direction. In an uptrend the price remains above the MA which often becomes a support during pullbacks (similarly – in a downtrend the price remains below the MA, which acts as a resistance during short counter rallies.)
Consolidation Brakeout
After a significant move the stock should go through a consolidation phase. Stage 2 may have several consolidation phases which draw different patterns on the chart. Breaking out from a consolidation is another great opportunity to buy, especially for shorter term traders.
Example

The Stage 2 fades, when:
After several months of bullish bliss as the fundamentals start to improve and more and more investors belatedly jump on the bullish bandwagon, the stock will eventually start to sag closer and closer to its MA. The angle of ascent of the MA will slow down considerably. At this point, the stock is a “hold”. Although it is still in Stage 2, this stock is now trading far above its support level and MA and is being discovered by the investment community; it is overextended and most definitely no longer a buy. This is the point where buying puts you at considerable risk. 6
Stage 3. The Top Area
At some point the early owners of the stock decide to rack up their profits. They start selling the stock putting pressure on its price. At this point the stock has become so popular that there are waves of new buyers catching every dip. This causes an intense volatility in the stock’s price – one of the characteristics of Stage 3. The stock starts to trend sideways in sharp and choppy pattern, accompanied by huge volume – in trading nomenclature such move is called “churning“.
The MA starts to flatten out. The stock will tiptoe below and above it on declines and rallies.
Once a Stage 3 top starts to form, traders should get the heck out with their profits! Investors, however, have more leeway. Once this stage is reached, I suggest that investors take profits on only half of their positions. There is always the chance that the stock will break out on the upside again, beginning yet another Stage 2 upleg. 7
At this stage Weinstein warns to be prudent:
Be very careful to keep your emotions in check in Stage 3, because the stories about the stock will usually be exciting and the news glowing (good earnings, stock splits, and so on). (…) So remember – no matter how powerful the fundamentals, no matter how convincing the story, you are never going to buy a stock in this stage because the reward/risk ratio is strongly stacked against you. 8
Stage 4. The Declining Phase
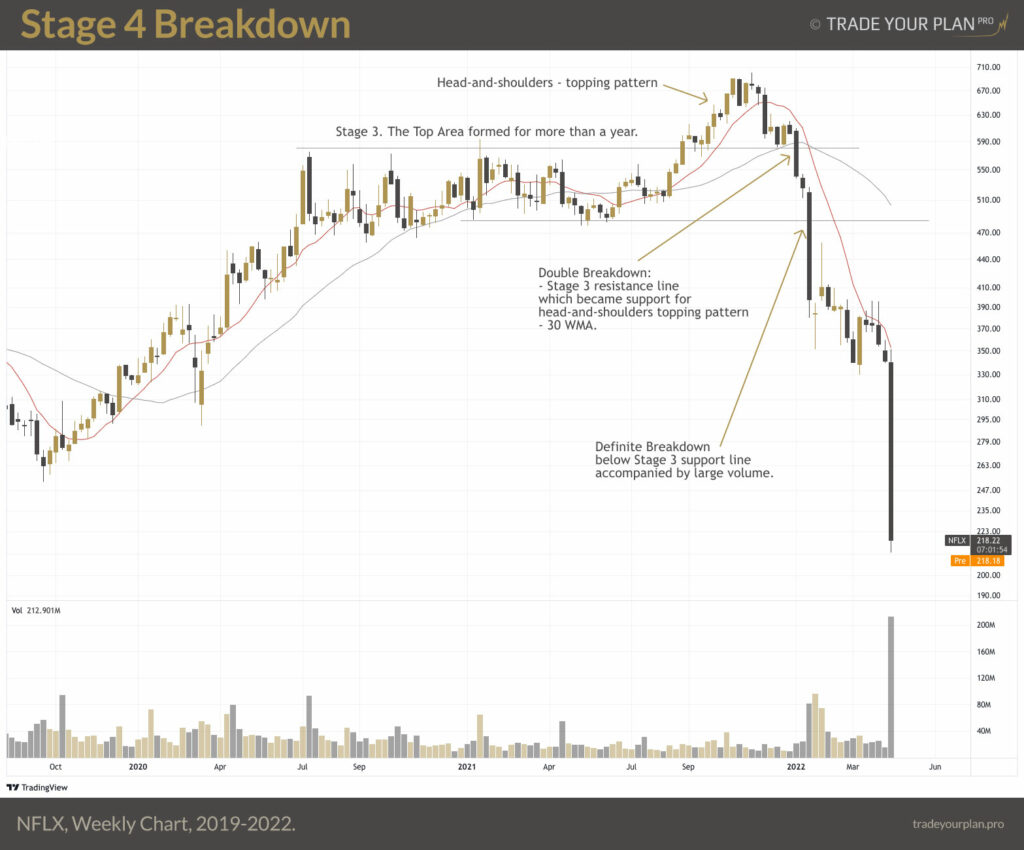
At some point the volatility of Stage 3 wears the investors out. Exhausted and fearful, they start to jump ship. While in Stage 3 the chart bounced off of a support zone, it eventually breaks below it marking the beginning of Stage 4. This is the moment the investor should unquestionably sell the stock. There might be a quick pullback to the broken support line, which now becomes resistance.
Weinstein emphasises that the downside break into Stage 4 does not necessarily need to be followed by a considerable increase in volume.
The conventional thinking as Stage 4 starts to unfold is usually that the stock is just undergoing a correction. This is nonsense. Once the stock breaks into Stage 4, the upside potential is very small, while the downside risk is considerable. 9
Take the oath that you are never going to buy another stock in Stage 4. Also promise yourself that you will never hold onto any of your stocks once they move into Stage 4. 10
Example

Conclusions
Weinstein’s Sector Analysis has been widely used by scores of successful investors and traders. There is a motion among short-term traders that the Stage Analysis strategy may be implemented in any timeframe – even on intra-day charts. In any case the rules to follow are the same:
- Always check the chart of the stock before committing your capital.
- Avoid buying stocks in Stage 1 until they breakout into a Stage 2, because capital can become tied up when a stock bases for a long period of time.
- Never buy a stock below a Moving Average, which corresponds to the timeframe you focus on.
- Never buy a stock, which broke below support and is clearly in Stage 4.
Resources
- See all posts related to Stan Weinstein
- Stage Screener by NextBigTrade – an excellent screener created by private investor with stocks grouped into sectors and stages they are currently in.
- TradingView – the best charting platform with free and premium plans.
The Book
Weinstein’s Book with his meticulously explained strategy is a highly recommended read.
Bibliography:
- Weinstein, Stan. Secrets for Profiting in Bull and Bear Markets. McGraw-Hill, 1988, p. 31.
- Ibid.
- Ibid, p. 15.
- Ibid, p. 33.
- Ibid, p. 34.
- Ibid, p. 35.
- Ibid, p. 37.
- Ibid, p. 38.
- Ibid, p. 39.
- Ibid, p. 40.
